
Table of Contents
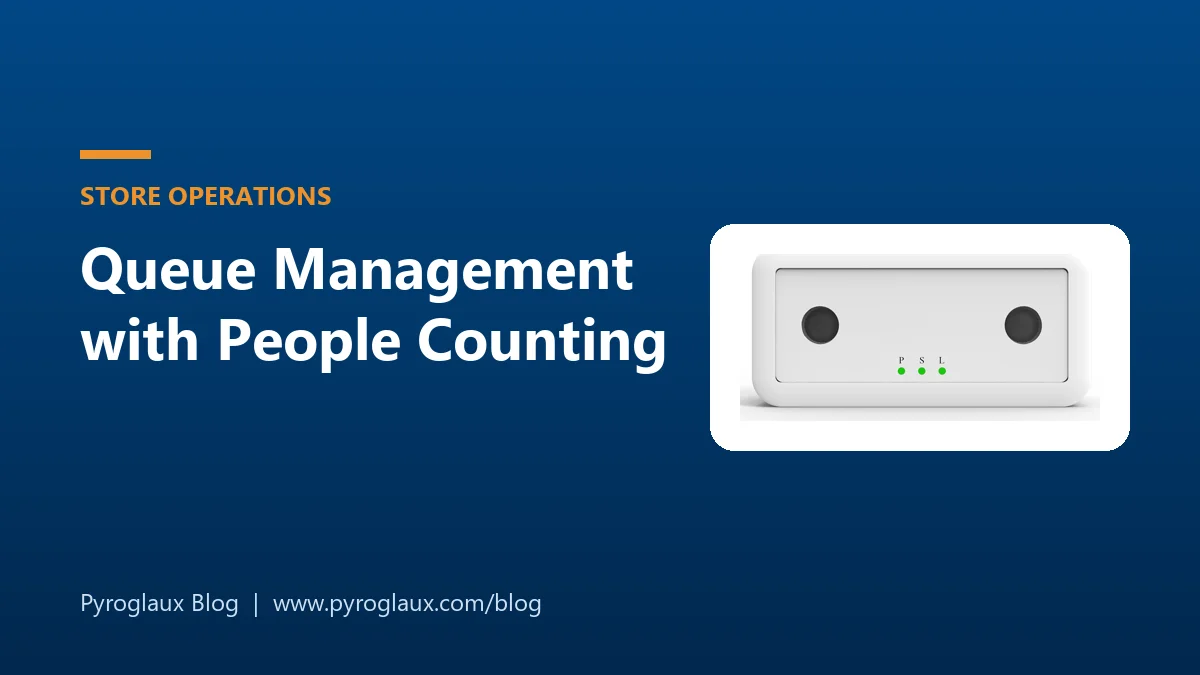
Queue management with people counting uses sensors at the entrance and above the checkout area to measure how many people are waiting and for how long, predict demand a few minutes ahead, and alert staff to open a till before the line gets long. Shorter waits mean fewer customers abandoning their purchase, better satisfaction and more efficient use of staff hours.
This guide covers the metrics, the counting setup, the maths behind wait time predictions, and how to turn the data into alerts and staffing plans.
Why queues cost more than they seem
- Abandoned purchases. Shoppers who see a long line may leave items behind or walk out, and this lost revenue never appears in sales data.
- Lower satisfaction. Waiting time is one of the strongest drivers of how customers rate a visit.
- Wasted labor. Opening tills too late creates queues; opening too many leaves cashiers idle. Both cost money.
- Safety and crowding. In stations, venues and public offices, uncontrolled queues block walkways and exits.
The queue metrics that matter
| Metric | What it shows | How it is measured |
|---|---|---|
| Queue length | People waiting right now, per lane or area | Zone count from overhead sensors |
| Waiting time | Minutes from joining the queue to being served | Dwell time in the queue zone, or estimated with Little's Law |
| Service rate | Customers served per minute per till | Exits from the queue zone, or POS transactions per till |
| Arrival forecast | Checkout demand in the next 10 to 20 minutes | Entrance counts and typical visit length |
| Abandonment | People who leave the queue before being served | Zone exits without a matching transaction |
Where to place the counters
Store entrances: the early warning
Every visitor who enters will reach the checkout a little later. Entrance counts therefore give an early warning: a rise in arrivals now means a rise in checkout demand after the typical visit length, often 10 to 30 minutes in grocery and convenience formats. Accurate entrance counting is the basis; overhead 3D counters are the usual choice for busy doors.
Queue zones: the live picture
Overhead sensors above each queue area count how many people stand in the zone and how long they stay. For single-line queues feeding several tills, one zone covers the whole line. For separate lanes, each lane gets its own zone. 3D sensors separate people standing close together and ignore trolleys and baskets, which matters in tight checkout spaces.
Till and service points
Counting exits from the queue, or reading transactions from the POS, gives the service rate per open till.
The maths: estimating wait time with Little's Law
Little's Law, a basic result of queueing theory, connects three numbers:
Average waiting time = People in the queue ÷ Service rate
Example: five people wait at a till that serves one customer every two minutes, a service rate of 0.5 customers per minute. The expected wait is 5 ÷ 0.5 = 10 minutes. If a second till opens and the line is shared, the service rate doubles and the expected wait falls to about 5 minutes.
Many queue displays use exactly this calculation, refreshed every few seconds, to show customers an expected waiting time and to trigger staff alerts.
Predicting how many tills to open
Entrance counts turn into a till plan with a simple calculation. The numbers below are illustrative assumptions for a supermarket peak hour:
| Step | Example |
|---|---|
| Visitors entering in the next hour (forecast from counts) | 600 |
| Conversion rate (share who buy) | 70% |
| Transactions expected | 600 × 0.70 = 420 |
| Transactions one staffed till handles per hour | 30 (about 2 minutes each) |
| Tills needed, before self-checkout | 420 ÷ 30 = 14 |
Run the same calculation every 15 minutes with live entrance counts, shift it forward by the typical visit length, and the store knows when to call staff to the tills before the line forms. Over weeks, the same data builds an hour-by-hour staffing plan by weekday. For how conversion data adds up to a business case, see our retail people counter ROI examples.
Turning data into action
- Threshold alerts. Notify supervisors when a queue zone exceeds a set number of people or a set waiting time, for example more than four people or more than five minutes.
- Predictive alerts. Warn staff 10 to 15 minutes ahead when entrance counts point to a checkout peak.
- Customer displays. Show expected wait times or direct customers to the next free till or self-checkout.
- Staff scheduling. Use weeks of queue and entrance data to plan till staffing by hour and weekday.
- Layout decisions. Compare single-line and multi-line queues, or the effect of more self-checkout kiosks, on measured wait times.
Beyond retail
The same approach works wherever people wait: bank branches and service halls, government offices, airports and security checkpoints, ticket offices, stadium entrances and restrooms at busy venues. In public settings, queue counts also support crowd safety and staffing at peak times. For large centers, see our guide to people counting for shopping malls.
Implementation checklist
- Map entrances, queue areas and service points, with ceiling heights and lane widths.
- Decide the queue layout to measure: single line, separate lanes or self-checkout area.
- Install entrance counters and zone sensors, and connect them to a dashboard or alerting system through an API. Our people counting API guide shows typical formats.
- Collect two to four weeks of data to learn typical visit length, conversion and service rates.
- Set alert thresholds with store managers, and review them after a month.
- Track abandonment and waiting time as KPIs alongside sales.
Where Pyroglaux fits
Pyroglaux supplies 3D stereo people counters for entrances and queue zones, such as the PCBot-R40, which counts people standing close together and measures dwell time in defined zones, plus dedicated queue management counters. Send us your checkout layout and peak traffic figures, and we will recommend a sensor layout and alert setup.
Frequently Asked Questions
How do people counters measure queue length?
Overhead sensors above the queue area count how many people are inside a defined zone, in real time. Some systems also track how long each person stays in the zone, which gives the actual waiting time.
How can wait time be estimated from counts?
With Little's Law: average wait equals the number of people in the queue divided by the rate at which they are served. Five people waiting at a till that serves one customer every two minutes means about ten minutes of waiting.
Can people counting predict how many tills to open?
Yes. Entrance counts lead checkout demand by roughly the typical visit length. Visitors per interval, multiplied by conversion rate and divided by transactions per till, gives the number of tills needed shortly afterwards.
Does queue management work with self-checkout?
Yes. The same zone counts show how many people wait for self-checkout kiosks and for staffed lanes, so staff can guide customers to the shorter option and open lanes when both are busy.
Is queue monitoring privacy friendly?
It can be. 3D sensors count heads from depth data without storing images, and the system only needs anonymous counts and dwell times per zone.
Planning a people counting project?
Tell us the site type, entrance widths and mounting height. We reply with a model recommendation and a quotation within one working day.
Get a quoteRecent Articles
- Static vs Dynamic Volume Measurement: How to Choose a Parcel Dimensioning System · Nov 02, 2026
- Workplace Occupancy Sensors: Types, Accuracy and How to Choose · Oct 30, 2026
- People Counting for Shopping Malls: Where to Count, What to Measure and How to Use the Data · Oct 28, 2026
- Sourcing Thermal Imaging Cameras from China: Specs, Compliance and Supplier Checks · Oct 26, 2026
- AXIS P8815-2 3D People Counter Discontinued: Specs, Support Dates and Alternatives · Oct 23, 2026