



Desk Occupancy Sensors: The Complete Guide for Modern Workplaces
2026-08-29 16:30A desk occupancy sensor is a ceiling or under-desk device that reports whether a workstation is in use, how long the workstation stays occupied, and how that pattern changes by hour and by weekday. Workplace teams install a desk occupancy sensor system to replace badge swipes and booking records with a measured record of what actually happens on the floor.
The gap between booked and used is the reason the category exists. Booking data alone overstates real utilization by 15-25% according to OfficeRnD's 2026 office utilization analysis, because a reserved desk that nobody sits at still reads as occupied in the booking tool. A desk occupancy sensor closes that gap by measuring the seat rather than the calendar, which is why desk occupancy sensor deployments now sit alongside badge systems rather than replacing them outright.
What Is a Desk Occupancy Sensor?
A desk occupancy sensor detects the presence of a person at a single workstation and turns that presence into a time series. The output is not a photograph and not an identity. The output is a state (occupied or free), a timestamp, and a duration.
Three deployment positions are common for an office occupancy sensor. Under-desk sensors mount beneath the work surface and cover one seat, and a hot desking sensor of this kind is what most flexible-seating programmes start with. Ceiling sensors mount overhead and cover a zone of several desks. Doorway counters sit at the entrance and measure how many people are inside the floor as a whole.
Most workplace occupancy analytics programmes end up combining the three. A doorway counter answers how busy the building is. A ceiling sensor answers which neighbourhoods fill first. An under-desk occupancy sensor answers which individual seats are dead weight.
Why Do Modern Workplaces Need Occupancy Data?
Offices are running at roughly half the density they were designed for, and the shortfall is invisible without measurement. Global workplace utilization reached 45% by March 2026 and averaged 43% across 2025, against a pre-pandemic baseline of 60-65%.
The averages hide the more useful detail. Around 25% of desks go completely unused on a given day. A further tranche is barely touched: 65% of desks are occupied for less than three hours, and only 17% see more than five hours of use.
Weekday shape matters as much as the average when sizing an office occupancy sensor deployment. Tuesday peaks at 52% and Wednesday at 51%, Monday sits at 41%, and Friday falls to 30%. A workplace sized for the Friday average is unusable on Tuesday, and a workplace sized for Tuesday is two-thirds empty on Friday.
| Work model | Target utilization | What a sensor confirms |
|---|---|---|
| Full return to office, 5 days | 70-85% | Whether assigned seating is genuinely full |
| Structured hybrid, 3 days | 55-70% | Which anchor days actually cluster |
| Flexible hybrid, employee choice | 40-60% | How wide the peak-to-trough swing runs |
| Hot desking, no assigned seats | 60-75% | Whether the desk pool is sized correctly |
Source: target ranges published by OfficeRnD, Office Utilization Rate guide (2026). Utilization figures: XY Sense Workplace Utilization Index, Q4 2025-Q1 2026, aggregated from 63,000+ workspaces across nine countries.
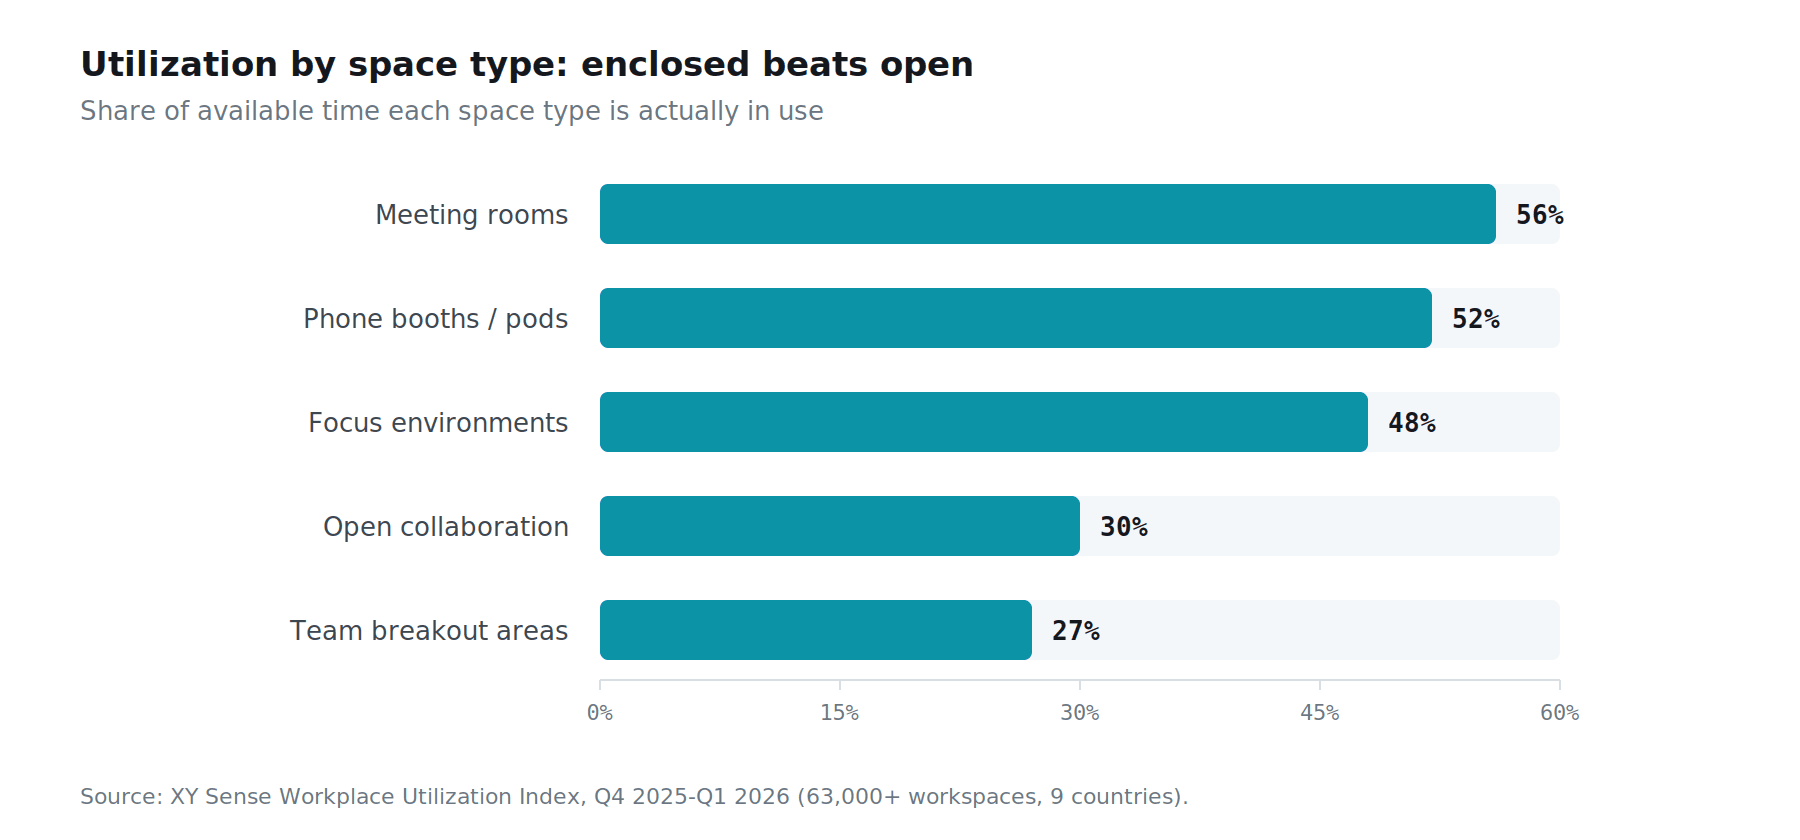
Space type splits the picture further. Enclosed space measures far better than open space: meeting rooms run at 56% and phone booths at 52%, while open collaboration areas sit at 30% and team breakout areas at 27%. A floor plan drawn around open collaboration is chasing the least-used category.
Which Sensing Technology Should a Workplace Choose?
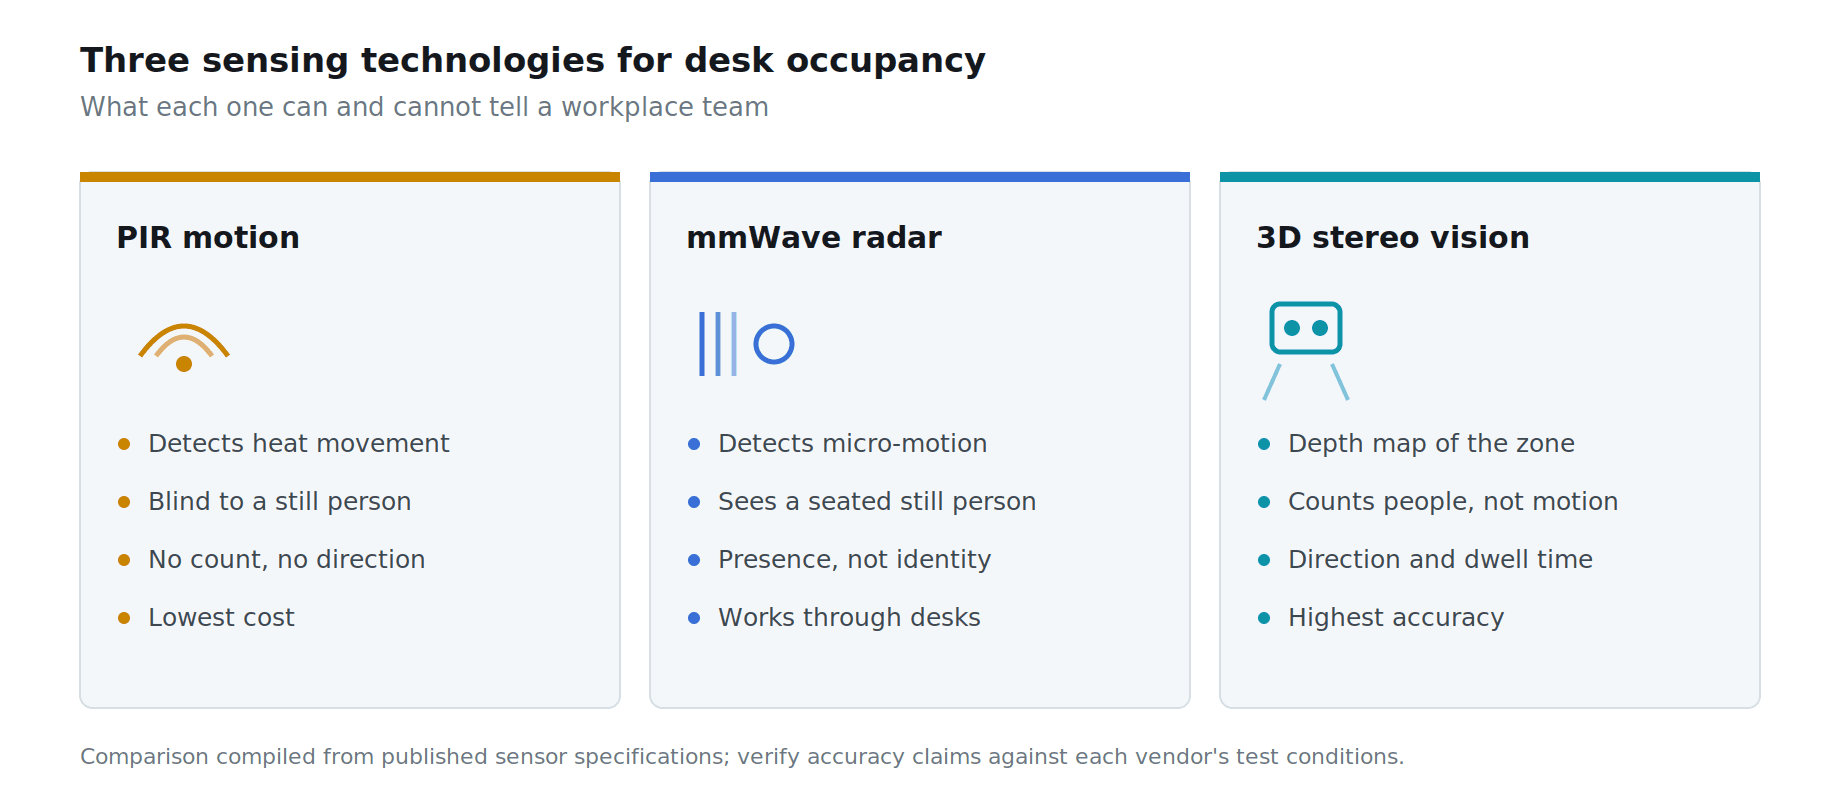
Three technologies dominate desk-level sensing, and the correct choice depends on whether a still, seated person must be detected. The still-person requirement eliminates the cheapest option immediately.
How does a PIR desk occupancy sensor work?
A passive infrared sensor fires when a warm body moves across the field of view. A person reading quietly at a desk stops registering after the timeout expires, so PIR reports the seat as free while somebody is still sitting in the seat.
A PIR desk occupancy sensor remains useful for lighting control, where a false negative simply dims a lamp. For utilization reporting the false negatives accumulate into a systematically understated occupancy figure.
How does mmWave radar compare?
Millimetre-wave radar detects micro-motion such as breathing, so a seated still person continues to register. Radar also passes through desk material, which allows a discreet under-desk occupancy sensor mounting without a visible lens.
The trade-off is spatial resolution. Radar reports presence within a zone reliably but struggles to separate two adjacent people, which limits radar to per-seat rather than per-area counting.
Where does 3D stereo vision fit?
A 3D stereo sensor builds a depth map of the covered area, which allows counting rather than mere presence detection. Depth separates two people standing close together, gives direction of travel, and yields dwell time per zone.
Pyroglaux supplies 3D stereo devices with supplier-stated counting accuracy in the 95-99% band, with retail-grade models specified at 98% or better, mounted between 2.2 m and 6.0 m and covering a span of 1.2-5.5 m depending on height. Confirm the figure for a specific model against the datasheet before quoting the number to a client.
Ceiling mounting accounted for more than 39% of people counting system revenue by mounting platform in 2024, according to Grand View Research, which reflects how most sites end up deploying overhead sensing. A ceiling-mounted people counting sensor covers a cluster of desks rather than a single seat.
Is a Desk Occupancy Sensor GDPR Compliant?
A desk occupancy sensor that never transmits an image and never links a seat to a named person processes no personal data, and privacy-by-design is what keeps the deployment in that category. The compliance question turns on system architecture, not on the sensor label.
Four architectural choices carry the argument. Depth frames are processed on the device and discarded rather than streamed. The payload leaving the sensor carries counts, timestamps and durations only. No identifier ties a seat event to an employee record. Aggregation thresholds prevent a single occupant from being isolated in a small zone.
Works councils and employee representatives generally ask a narrower question than regulators do: can this system tell my manager how long I was at my desk? A sensor reporting zone-level aggregates over 15-minute buckets cannot answer that question, and saying so plainly shortens the consultation.
Publish the retention period, the aggregation window and the list of fields collected before installation begins. Workplace analytics programmes that skip the disclosure step usually stall at the consultation stage rather than the technical one.
What Does the Return on Investment Look Like?
The payback on workplace occupancy analytics comes from floor area, not from the hardware line item. Real estate is the largest fixed cost in most office portfolios, so a measured reduction in provisioned desks dwarfs the sensor spend.
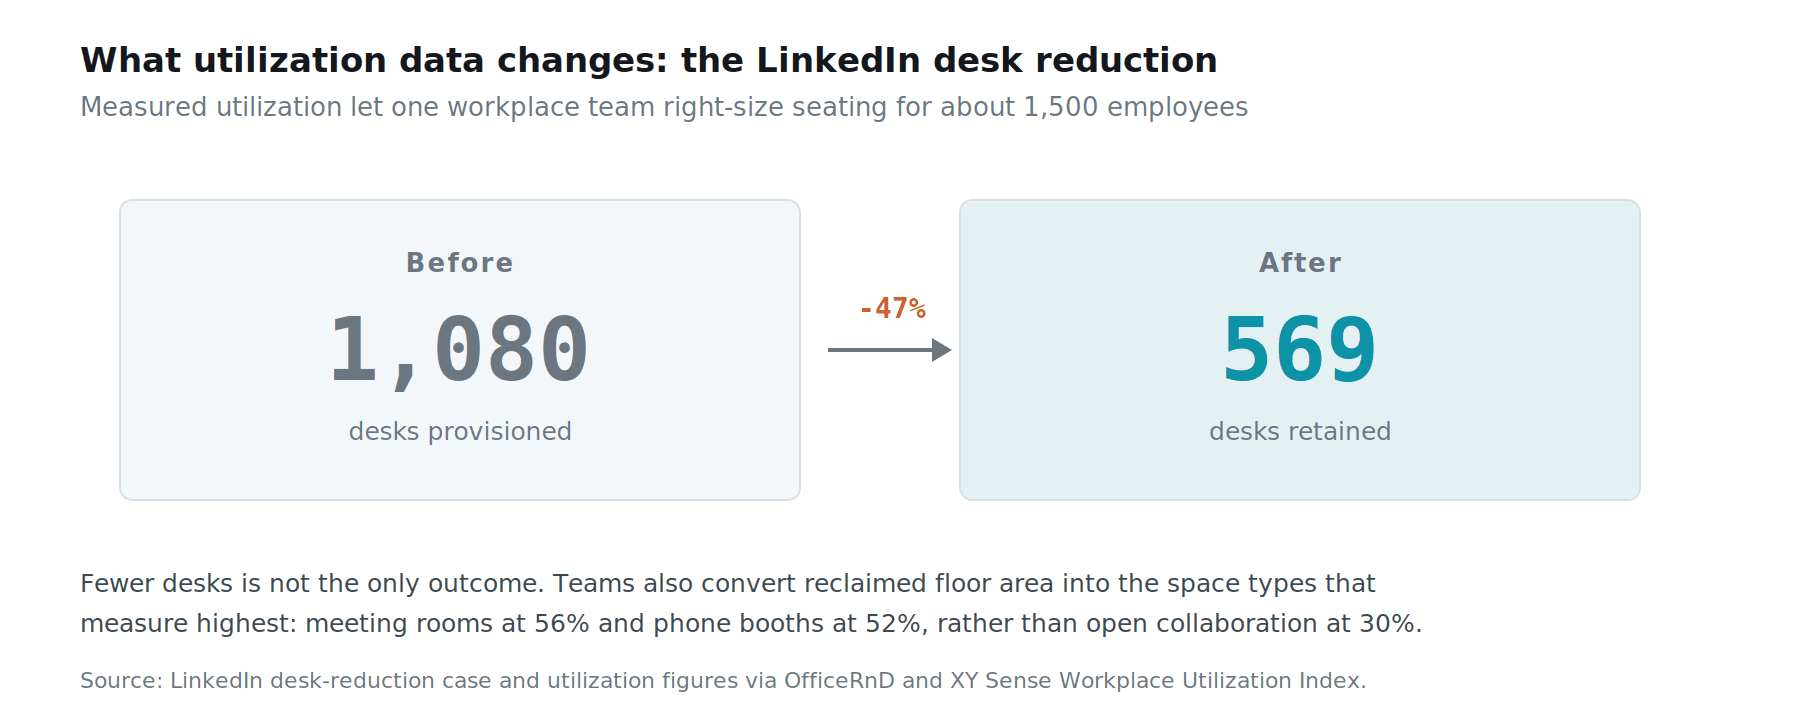
One documented example, published by OfficeRnD: LinkedIn reduced provisioned desks from 1,080 to 569 for roughly 1,500 employees after modelling measured utilization, a reduction of about 47%. The reclaimed area was not simply removed from the lease in every case.
Reallocation is often the better move. Meeting rooms measure at 56% utilization and phone booths at 52%, while open collaboration areas sit at 30% and team breakout areas at 27%. Converting under-used open space into enclosed space follows the demand the sensors actually recorded.
How Do Desk Sensors Connect to a Wider Counting System?
Desk-level data becomes far more useful when the data joins building-level counting from the same platform. A desk occupancy sensor answers which seats are used; a doorway counter answers how many people are in the building to use those seats.
A doorway people counting sensor and a desk sensor joined on the same timeline turn a utilization percentage into a capacity plan. If 400 people enter the floor and 180 desks register occupancy, the difference is sitting in meeting rooms, phone booths and collaboration space, and that split is exactly what the space-type reallocation decision needs.
Both device families in the Pyroglaux range expose the same HTTP JSON interface, so a workplace dashboard consumes desk events and doorway events through one parser. Deployment teams can review the people counting software and API integration guide before writing the first request.
FAQ About Desk Occupancy Sensors
Does a desk occupancy sensor need Wi-Fi?
No, and Power over Ethernet is the more common choice for ceiling-mounted units. PoE delivers power and data over one cable, which removes the need for a socket above the ceiling tile. Battery-powered under-desk units use a low-power wireless protocol instead, and battery life is the specification to check.
How accurate is a desk occupancy sensor?
Desk occupancy sensor accuracy varies by technology far more than by brand. PIR understates occupancy whenever people sit still. Radar and 3D stereo devices report a seated still person correctly. Ask any supplier for the mounting height, the coverage diameter and the test conditions behind a quoted accuracy figure, because a number quoted without those three variables cannot be compared.
Can one sensor cover several desks?
Yes, a ceiling-mounted people counting sensor covers a zone rather than a single seat. Coverage depends on mounting height: a device installed at 3 m covers a smaller footprint than the same device at 5 m. Zone coverage lowers the device count per floor but reports occupancy for the cluster rather than for one named seat.
How long does a desk occupancy sensor deployment take?
A single floor of desk occupancy sensor hardware typically goes in over one to three days once cabling is available. The slower path is usually approval rather than installation. Budget several weeks for works council consultation and privacy review in European deployments, and run that process in parallel with the hardware order.
What is the difference between occupancy and utilization?
Occupancy is a state at a moment; utilization is that state averaged over time. Workplace occupancy analytics reporting almost always wants the second figure. A desk that is occupied at 10:00 has 100% occupancy at that instant and may still show 20% utilization across the working day. Workplace reporting almost always wants the utilization figure, measured against opening hours rather than against 24 hours.
How many weeks of data are needed before making a decision?
Four full weeks is the practical minimum, and eight weeks is safer. Weekday shape swings widely, from 52% on Tuesday to 30% on Friday, so a short sample taken in one part of the week produces a misleading portfolio decision. Public holidays and school terms distort shorter windows further.
Getting Started
An office occupancy sensor rollout should start with one floor and one question. Measure the current utilization baseline, compare that baseline against the target band for the operating model in use, and only then decide whether the answer is fewer desks, different space types, or a change to anchor days.
Pyroglaux supplies desk occupancy sensors and zone sensors built on 3D stereo vision, with PoE, an open HTTP JSON interface and no mandatory cloud subscription. Request a sample unit through the contact page, or review the full range on the smart counting product page.