



Retail Metrics Glossary: 40+ Store Traffic, Layout and Merchandising Terms Explained
2026-08-11 20:00Retail metrics describe how a store turns passing traffic into revenue. The core relationship is a multiplication chain: Sales = Footfall × Capture Rate × Conversion Rate × Average Transaction Value. Every term in this retail metrics glossary sits somewhere on that chain, measuring traffic, shopper behaviour, sales, layout, or supplier agreements.
Store teams often track retail metrics that do not connect to each other. A glossary of retail metrics fixes the problem by showing where each figure belongs. As a manufacturer of people counting devices, our team at PanPanTech built this reference from the questions retail operators ask us during deployments.
The multiplication chain works as a diagnostic order for retail metrics. Footfall counts who walked past and came in, capture rate measures the share of passers-by who entered, conversion rate measures the share of visitors who bought, and average transaction value measures how much each buyer spent. Weakness in any single link caps the entire result.
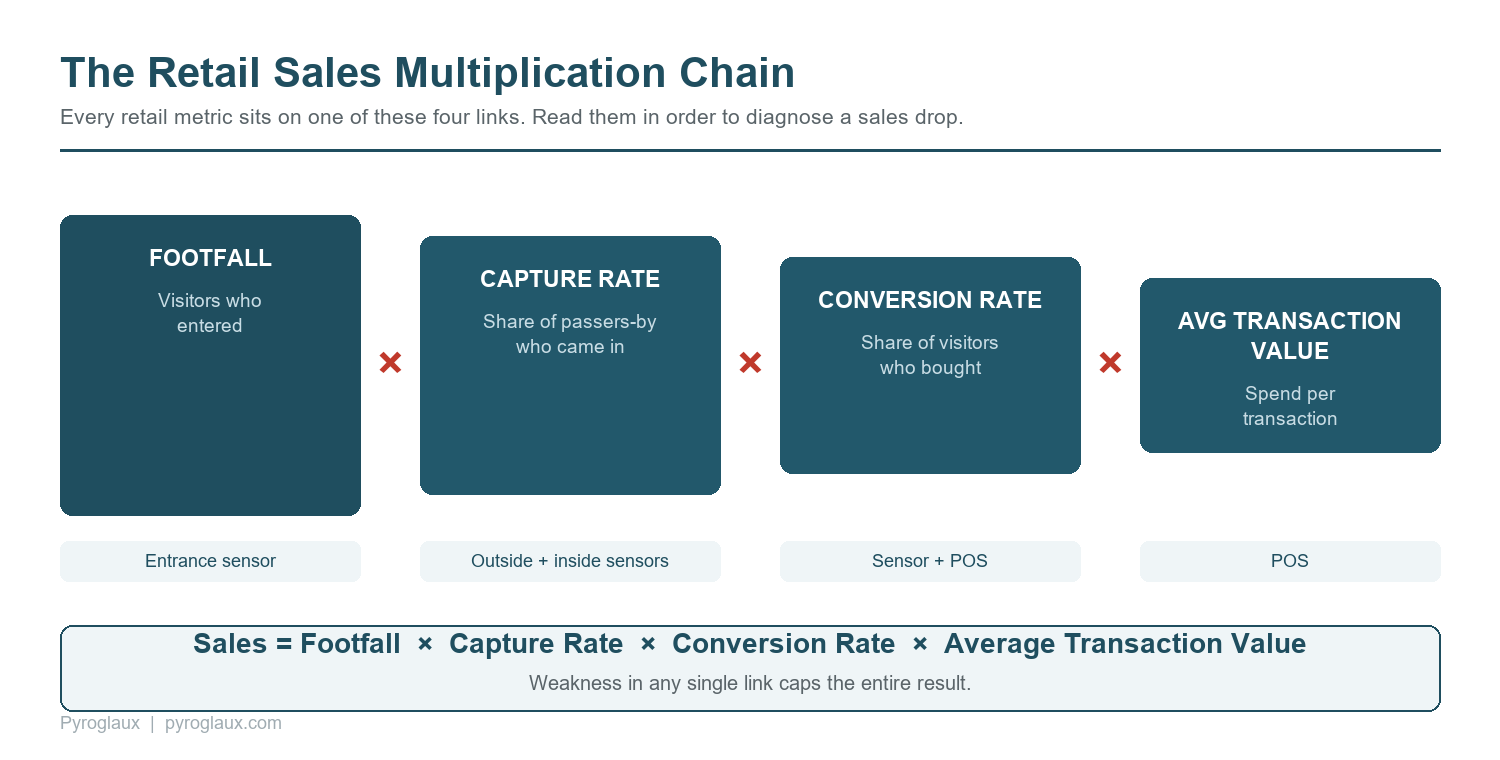
Figure: the retail sales multiplication chain that organises every metric in this glossary.
Section A: Traffic Metrics
Traffic retail metrics answer one question: how many people came, and when. Traffic figures form the top of the funnel, and every downstream rate depends on measuring these retail metrics correctly.
| Term | Definition | Data source |
|---|---|---|
| Footfall (store traffic) | Cumulative number of visitors entering over a period | Entrance sensor |
| Capture rate (hook rate) | Share of passers-by who enter the store | Outside + inside sensors |
| Occupancy | Number of people inside at a given moment | Bidirectional counting |
| Peak hour | Hour with the highest visitor volume | Entrance sensor |
| Traffic distribution | Spread of visitors across hours or days | Entrance sensor |
| Weather-adjusted traffic | Traffic compared on a like-for-like weather basis | Sensor + weather data |
| Staff-to-traffic ratio | Staff hours scheduled per unit of visitor traffic | Sensor + rota system |
What is the difference between footfall and occupancy?
Footfall is cumulative, occupancy is instantaneous. A store visited by 800 people across a day has a footfall of 800, yet occupancy at 3 p.m. might be 42. Confusing the two retail metrics leads to wrong conclusions: occupancy drives safety limits and queue planning, while footfall drives conversion and marketing analysis.
How is capture rate measured?
Capture rate requires two measurements: people passing the storefront and people entering. One sensor alone cannot produce the figure, so a second unit facing the walkway or mall corridor is needed. Capture rate varies enormously by format, location, and frontage, so compare against a store's own history rather than a published benchmark.
Section B: Behaviour Metrics
Behaviour retail metrics describe what shoppers do between the entrance and the till. Behaviour data explains why a conversion rate moved, which traffic retail metrics alone can never reveal.
| Term | Definition | Data source |
|---|---|---|
| Dwell time | Time a shopper spends in the store or a zone | Zone sensors / video |
| Shopper path (customer flow) | Route a shopper walks through the store | Multi-point tracking |
| Hot zone | Area with high dwell and visit frequency | Heat map |
| Cold zone (dead zone) | Area shoppers rarely reach or stop in | Heat map |
| Pick-up rate (touch rate) | Share of passing shoppers who handle a product | Shelf sensor / video |
| Bounce | Visitor who leaves shortly after entering | Sensor + dwell |
| Queue length / wait time | People waiting and minutes spent waiting at checkout | Checkout-area sensor |
Customer flow and shopper path describe the same idea: the route a shopper actually walks through the store. Both terms are standard in English-language retail briefs, and using them consistently avoids confusion when working with international design or analytics teams.
Section C: Sales Metrics
Sales retail metrics convert visitor behaviour into money. Sales retail metrics come mostly from the point-of-sale system, except conversion rate, which needs traffic data as well.
| Term | Formula or definition | Data source |
|---|---|---|
| Conversion rate | Transactions ÷ visitors | Sensor + POS |
| Average transaction value (ATV) | Revenue ÷ transactions; also called average basket | POS |
| Units per transaction (UPT) | Items sold ÷ transactions | POS |
| Sales per square foot (SPSF) | Revenue ÷ selling area, per square foot (or per square metre) | POS + floor area |
| Sell-through rate | Units sold ÷ units received, over a period | Inventory + POS |
| Shrinkage | Inventory loss as a share of sales | Stock count |
| Same-store sales (like-for-like) | Sales compared across identical store sets year on year | POS |
What is a good retail conversion rate?
Conversion benchmarks depend heavily on format, because purchase intent differs at the door. Grocery and convenience retail typically converts at 60 percent or above, fashion and apparel between 20 and 30 percent, and specialty retail and footwear roughly 25 to 35 percent.
| Format | Typical in-store conversion |
|---|---|
| Grocery / convenience | 60% and above |
| Fashion / apparel | 20–30% |
| Specialty retail / footwear | 25–35% |
Source: TruRating, Retail Conversion Analysis.
How is sales per square foot calculated?
Divide net revenue for a period by selling area in square feet, excluding stockrooms and offices. Across the United States a typical store generates roughly 451 to 733 US dollars per square foot (about 4,850 to 7,890 per square metre), while shopping-mall stores average around 481 dollars per square foot (about 5,180 per square metre).
| Benchmark | Per square foot | Per square metre (approx.) |
|---|---|---|
| Typical US store range | $451 – $733 | $4,850 – $7,890 |
| US shopping-mall average | $481 | $5,180 |
Source: Shopify, Sales per Square Foot by Industry; US retail sales per square foot rose 4.3 percent year on year in Q2 2026 per Newmark.
Section D: Layout and Merchandising Terms
Layout terms describe the physical decisions that shape the behaviour retail metrics above. Layout vocabulary is not made of retail metrics itself, yet precision matters here, because several fixture names are widely mistranslated in international briefs, and the errors then corrupt the retail metrics built on top of them.
| Term | Definition |
|---|---|
| Planogram | Diagram specifying where each SKU sits on a fixture |
| Facing | Number of identical product fronts visible on the shelf |
| Eye level (golden zone) | Shelf height aligned with a shopper's natural sightline |
| End cap | Promotional display at either end of a gondola run |
| Floor display / island display / pallet display | Free-standing promotional unit placed on the floor |
| Dump bin | Open bin holding loose discounted stock |
| Gondola | Double-sided free-standing shelving unit |
| Decompression zone | Transition area just inside the entrance, roughly 3–5 m deep |
| Power aisle (main aisle) | Primary circulation route carrying the most traffic |
| Cross-merchandising | Displaying complementary categories together |
Is an end cap the same as a floor display?
No. An end cap is attached to the end of a shelving run, while a floor display stands independently on the sales floor. Translated merchandising briefs frequently label a free-standing promotional stack as an "end cap", which names a different fixture at a different price. Reserve end cap for a unit built onto the end of a gondola run, and use floor display, island display, pallet display, or dump bin for free-standing promotional units.
What happens in the decompression zone?
Shoppers entering a store need a few metres to adjust before they start shopping, so merchandise placed immediately inside the door is frequently ignored. Retail anthropologist Paco Underhill named the area the decompression zone, and also observed that shoppers reflexively turn right on entering, a tendency he called the invariant right (Paco Underhill, Why We Buy: The Science of Shopping, Simon & Schuster, 1999).
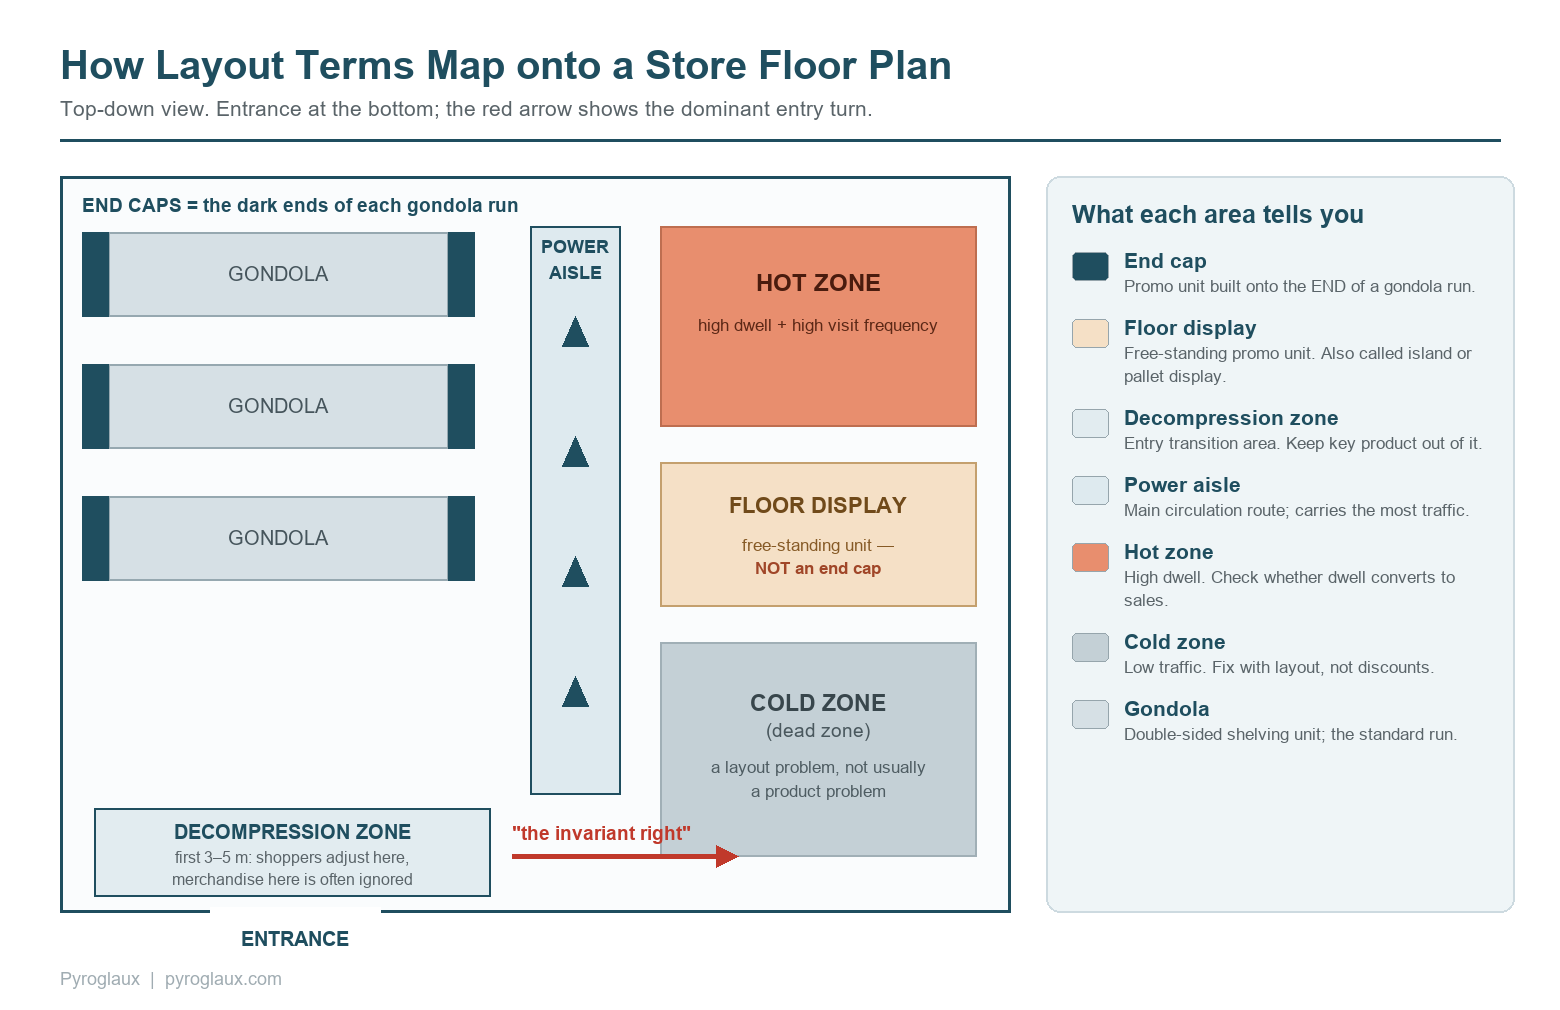
Figure: how layout terms map onto a typical store floor plan.
Section E: Commercial Terms
Commercial terms cover the money that moves between brands and retailers for shelf space. Brand teams meet the vocabulary during range reviews, and increasingly bring retail metrics to the table as evidence.
| Term | Definition |
|---|---|
| Slotting fee | Payment from a brand to a retailer to list a new product |
| Display allowance | Payment securing a specific display position |
| Pay-to-stay | Ongoing payment to retain existing shelf space |
| Trade promotion | Brand spending aimed at the retail channel |
| Retail media | Retailer selling its own touchpoints as advertising space |
Traffic data changes the negotiation. A display position measured by real retail metrics such as visitor counts and pick-up rate can be priced on evidence rather than on habit, which benefits both the retailer selling the space and the brand buying it.
How the Retail Metrics Connect
Read the multiplication chain in order, and a sales drop becomes a diagnosis instead of a guess. Work down the funnel one link at a time, because each layer explains the next.
| Step | Question | If weak, look at |
|---|---|---|
| 1. Footfall | Did fewer people come to the area at all? | Location, season, weather, marketing |
| 2. Capture rate | Did passers-by stop coming in? | Window, signage, entrance, lighting |
| 3. Conversion rate | Did visitors stop buying? | Staffing, stock, price, queue |
| 4. ATV / UPT | Did buyers spend less each? | Range, bundling, cross-merchandising |
Behaviour retail metrics sit alongside the chain as explanations, and pairing the two groups of retail metrics is what turns a dashboard into a decision. High dwell time with low conversion in one category suggests interest without purchase, which often points to price, missing information, or out-of-stock sizes. A cold zone with strong stock suggests a layout problem rather than a product problem.
Where Retail Metrics Data Comes From
Three separate systems produce the numbers, and no single system produces all of them. Knowing which source owns which of the retail metrics prevents teams from chasing figures their tools cannot generate.
| Data source | Measures | Cannot measure |
|---|---|---|
| Entrance and zone sensors | Footfall, capture rate, occupancy, dwell, shopper path, hot and cold zones | Revenue |
| POS system | ATV, UPT, sell-through, same-store sales, conversion when paired with traffic | How many people visited |
| Shelf-edge devices | Pick-up rate, price and promotion execution | Whole-store circulation |
Conversion rate deserves attention because the figure needs two systems at once. A store with only a POS system knows transactions but not visitors, so conversion stays invisible. Adding a 3D people counter at the entrance supplies the denominator and unlocks the whole middle of the funnel.
Attribution is the practical payoff of joined-up retail metrics. A sales decline on its own cannot tell a manager whether pricing failed or whether nobody walked in. Only by placing traffic data and price changes on the same timeline does yesterday's markdown become measurable, which is why sensing and shelf-side execution belong in one reporting view.
FAQ About Retail Metrics
Which retail metrics need a people counter, and which come from POS?
Footfall, capture rate, occupancy, dwell time, and zone heat maps come from people counting sensors. ATV, UPT, sell-through, and same-store sales come from POS. Conversion rate needs both systems together.
How accurate does traffic counting need to be for these retail metrics?
Aim for 95 percent or better at the entrance, because every downstream figure inherits the error. A store with 1,000 daily visitors measured by a 90 percent counter carries a 100-visitor margin of error, which is wider than most week-on-week changes and hides the very trend the metric is meant to show.
What is the difference between capture rate and conversion rate?
Among traffic retail metrics, capture rate measures the step from the pavement into the store, while conversion rate measures the step from browsing to buying. Both are ratios, yet each diagnoses a different failure: capture points to the storefront, conversion points to what happens inside.
Are dwell time and queue time the same thing?
No, the two retail metrics point in opposite directions. Dwell time measures engagement across the store or a zone and generally correlates with spending, whereas queue time measures waiting at checkout and tends to reduce satisfaction. Rising queue time inside a rising dwell time can cancel the benefit entirely.
How often should a store review these retail metrics?
Different retail metrics deserve different review cycles. Review traffic and conversion weekly for staffing and merchandising decisions, layout and zone metrics monthly, and space productivity such as sales per square foot quarterly. Daily review of a single day's figures usually reflects noise rather than a trend.
Can these retail metrics be collected without recording customer identities?
Yes, every traffic and behaviour metric in this retail metrics glossary can be produced anonymously. Modern counting sensors process video on the device and output only anonymous counts, storing no images and no identity attributes, which keeps privacy compliance straightforward for public retail spaces. Discuss a site-specific setup through the PanPanTech contact page.